


Commercial Cleaning Quality-Control Scorecard: KPIs Facility Managers Can Use

September 3, 2026

Share this article

Facility managers often struggle with service drift, where a cleaning crew performs well during the first sixty days and quietly deteriorates over the following months. Without objective data, addressing sub-par performance turns into an unproductive debate over subjective perceptions. Implementing a structured janitorial quality control scorecard gives operations directors the empirical leverage needed to hold cleaning contractors accountable. A standardized evaluation framework protects building hygiene, preserves asset life, and ensures contract terms match daily operational delivery across commercial properties.

What Is a Janitorial Quality Control Scorecard?

A janitorial quality control scorecard is a structured performance management tool used by facility directors to measure, evaluate, and document cleaning contractor performance against agreed service levels. It converts subjective visual assessments into quantifiable metrics, tracking key indicators such as inspection scores, defect rates, task completion, and response times across defined building zones.

Most cleaning contracts fail due to an absence of objective evaluation rather than bad intentions. When an office manager reports that an executive suite looks dusty or a tenant claims their entryway smells damp, the complaint is entirely qualitative. A vendor can easily respond that the crew completed their assigned rounds, creating an operational stalemate. A scorecard eliminates this friction by establishing agreed definitions of cleanliness before work begins.

A functional scorecard divides a facility into discrete functional areas, such as high-traffic lobbies, production zones, executive offices, and commercial restrooms. Each zone receives a weighted scoring rubric based on operational risk. For example, a missed trash bin in an administrative cubicle is an aesthetic nuisance, whereas an unsterilized touchpoint or an unstocked hand hygiene dispenser in an outpatient medical suite represents a regulatory deficiency.

By shifting conversations from emotional impressions to empirical ratings, facility directors create clear accountability. Cleaning vendors understand exactly what an inspector examines during an audit, which specific tasks trigger immediate deductions, and how sustained performance affects contract retention.

The 5 Core Metrics for Commercial Cleaning Performance

To monitor contractor consistency, operations teams should track five primary commercial cleaning KPIs that balance visual cleanliness, task execution, and dispute resolution.

Metric Name Formula / Calculation Operational Benchmark Data Source Corrective Action Trigger
Defect Rate (Total Failed Checklist Items / Total Inspected Items) × 100 Under 3.0% per inspection cycle Monthly visual audits and joint walkthroughs Defect rate exceeds 5.0% in any single building zone
Repeat Complaint Rate (Complaints on Identical Scope / Total Logged Complaints) × 100 Zero repeat complaints over a 30-day window Tenant work orders and facility ticketing systems More than 1 repeat ticket for the same issue in 60 days
Facility Inspection Score (Earned Audit Points / Total Possible Audit Points) × 100 90% or higher overall facility score Weekly mobile audits scored by supervisors Score falls below 85% on any single monthly audit
Janitorial SLA Closure (Defects Resolved Within Target Hours / Total Logged Defects) × 100 95% resolved within contract SLA targets Vendor work order logs and escalation timestamps Average resolution time exceeds 24 hours for minor defects
Missed Task Rate (Missed Periodic Scope Items / Scheduled Periodic Items) × 100 0% for daily scope; under 2% for periodic tasks Nightly shift logs and digital sign-off sheets Any missed specialty floor care or scheduled disinfection

1. Defect Rate

Defect rate measures the percentage of inspected touchpoints, surfaces, and fixtures that fail to meet documented scope specifications. An inspector auditing fifty distinct checklist items across four restrooms who finds two unemptied sanitary napkin receptacles and one dirty mirror records a six percent defect rate for that area.

Tracking defects across individual zones exposes crew habits that aggregate metrics conceal. In large multi-tenant buildings, a crew might maintain common lobbies in pristine condition to satisfy executive visitors while routinely cutting corners in service stairwells or secondary restrooms.

2. Repeat Complaint Rate

The repeat complaint rate tracks how often building occupants submit work orders for the exact same deficiency within a rolling thirty-day window. Single complaints happen in any working building because supplies exhaust unexpectedly and spills occur throughout the business day.

Repeat complaints indicate a systemic breakdown in supervision. When an office manager submits three consecutive tickets regarding unvacuumed conference room corners, the issue is no longer an oversight. It proves the vendor lacks an internal feedback loop between management and the evening cleaning crew.

3. Facility Inspection Score

The facility inspection score provides an aggregate health rating for your property, weighted by room type and traffic density. Most facility teams score items on a scale of one to five, where five signifies audit-ready perfection and one indicates complete non-performance.

To prevent grade inflation, avoid scoring buildings on a simple pass or fail basis. Weight the results so that heavily populated areas and hygiene-critical zones, including breakrooms and restrooms, dictate seventy percent of the overall score. Administrative storage and light-use utility rooms should make up the remaining balance.

4. Janitorial SLA Closure

Service Level Agreement (SLA) closure measures the speed and finality with which a cleaning vendor resolves logged issues. Contracts should define clear response windows based on severity tiers.

Emergency biohazard spills or overflowing plumbing fixtures require immediate containment within two hours. Standard service defects, like an overlooked dusting route or an unpolished glass partition, should be remediated before the next business morning. Tracking closure times ensures that logged issues do not languish indefinitely in an email inbox.

5. Missed Task Rate

Janitorial scopes combine daily recurring tasks with periodic deep cleaning, such as quarterly carpet extractions or monthly high-dusting of air returns. The missed task rate measures adherence to this scheduled periodic maintenance.

Contractors often perform daily trash and surface wiping reliably while letting periodic services slide off the schedule. Over six months, skipping monthly machine scrubs causes severe soil buildup on vinyl composite tile, shortening flooring life and creating expensive restoration requirements.

How to Run a Reliable Janitorial Quality Control Scorecard Cadence

A scorecard delivers value only when auditing follows a strict, repeatable cadence. Random or reactionary inspections triggered solely by tenant anger produce confrontational vendor relationships rather than sustained operational quality.

Establish Tiered Audit Frequencies

Divide your scorecard audits into three distinct operational intervals:

  • Weekly Supervisor Audits: The cleaning contractor supervisor conducts a digital inspection of twenty percent of the facility, rotating through different building wings every week.


  • Monthly Joint Audits: The facility manager and the vendor account manager walk the property together, auditing shared common spaces, mechanical areas, and tenant suites.


  • Quarterly Executive Reviews: Senior leadership reviews ninety-day trend lines, evaluates SLA closure compliance, and signs off on periodic project schedules.

In Southern New England, operational conditions change dramatically between seasons. Facilities managing winter entryways deal with abrasive ice melt, sand, and slush tracked across lobbies from December through March. Adjust seasonal inspection weights during these months to evaluate walk-off matting saturation, salt haze removal, and wet floor safety compliance. If you oversee commercial properties in Connecticut or Rhode Island, salt neutralization on hard surfaces must be verified on a weekly basis to prevent finish degradation.

Standardize the Evaluation Path

Inspectors must follow the exact same path through the facility during every audit. Start at the exterior entry vestibule, proceed through the reception foyer, move along primary circulation corridors, evaluate core restrooms, and conclude in tenant suites.

Varying the inspection path leads to inconsistent evaluations. A standardized route ensures every auditor reviews the building through the eyes of an arriving tenant or client, checking the same high-touch switch plates, baseboards, and glass entry doors in predictable order.

Diagnosing Quality Issues: Vendor Management Layer vs. Crew Execution

When scorecard metrics decline, facility managers frequently jump to the conclusion that the cleaning crew is inadequate and demand new personnel. In commercial facility management, crew changes rarely solve chronic cleanliness problems.

Most operational failures trace back to poor supervision, incorrect chemistry, or unrealistic production rates rather than crew indifference. A janitorial vendor that operates without a dedicated management layer forces the facility manager into the role of unpaid site supervisor. When evaluating poor metrics on your scorecard, diagnose the root cause across three operational layers:

Unrealistic Square-Footage Production Rates

Commercial cleaners can responsibly clean between 2,500 and 4,000 square feet of standard office space per hour, depending on layout density and fixture counts. When a vendor aggressively underbids a contract to win a procurement RFP, they often assign one cleaner to service 45,000 square feet in an eight-hour shift.

Under that operational burden, the worker must clean over 5,600 square feet per hour. Detailed tasks like wiping horizontal blinds, descaling faucet aerators, or spot-cleaning partition walls become mathematically impossible. The crew is not lazy; the contractor built a failure-prone staffing model.

Chemical and Equipment Deficiencies

Low inspection scores on restroom ceramic tile or resilient flooring often stem from worn equipment or improper chemistry. Using dirty string mops and saturated rinse water simply spreads emulsified grease and soil across grout lines, creating foul odors and dingy floors. Professional routine janitorial services rely on microfiber flat-mop systems, neutral pH surface cleaners, dual-compartment buckets, and HEPA-filtered backpack vacuums that capture fine particulate matter rather than redistributing dust into the ambient air.

Missing Management Oversight

The critical differentiator in commercial service delivery is the quality assurance layer between the building and the crew. A reliable provider assigns a dedicated account manager who visits the site on a scheduled frequency, runs independent audits, and corrects crew deficiencies before the facility director ever notices them.

Without this active management layer, service standards drift until tenant frustration boils over into executive escalations. Utilizing structured cleaning management programs for facility managers ensures that someone takes full operational ownership of the physical results.

Frequently Asked Questions

  • How often should a facility manager conduct a cleaning inspection?

    A facility manager should conduct formal visual cleaning inspections at least once per month alongside the contractor account manager. In addition to these joint monthly walkthroughs, the cleaning contractor should conduct weekly internal audits and share those inspection records directly with the facility team.


    High-traffic or regulated facilities, such as outpatient surgical clinics, manufacturing plants, and educational institutions, benefit from bi-weekly or weekly joint inspections. Keeping a steady schedule identifies minor defects before they compound into major lease disputes or compliance failures.


  • What is an acceptable defect rate for commercial office cleaning?

    An acceptable defect rate for general commercial office cleaning is three percent or lower across all audited checklist items. Critical hygiene zones, including breakrooms, food preparation areas, and restrooms, should maintain an operational defect rate under two percent.


    If an audit records an overall defect rate exceeding five percent, the facility manager should issue a formal notice requiring a written corrective action plan. A defect rate that remains above five percent across two consecutive monthly audits signals that the vendor is failing to provide adequate staffing or on-site supervision.

  • What should be included in a janitorial quality control scorecard?

    A complete scorecard must include categorical sections for common corridors, restrooms, tenant offices, breakrooms, and entry vestibules. Each section should list specific, observable criteria covering floor care, vertical and horizontal dusting, waste removal, glass cleanliness, and dispenser replenishment.


    Beyond physical checklist items, the scorecard should incorporate governance metrics. It must record inspection dates, names of auditing personnel, defect resolution deadlines, customer complaint logs, and overall percentage scores to establish clear historical trends over time.

  • How do you handle a cleaning vendor that consistently fails scorecard audits?

    Address consistent audit failures by implementing a formal thirty-day cure period tied to specific numerical targets on your scorecard. Present the documented inspection data to the vendor executive leadership, identifying the exact metrics that fall below contract standards.


    Require the contractor to provide a binding remediation plan that includes increased supervisory walkthroughs, staff retraining, or modified labor allocations. If the vendor fails to achieve the target inspection score by the end of the thirty-day cure period, the documented scorecard history provides clear legal justification for contract termination without penalty.


  • Can a quality control scorecard be used to benchmark multiple commercial buildings?

    Yes, a standardized scorecard is an ideal tool for portfolio property managers overseeing multiple commercial assets across a region. Using identical metrics, weighting criteria, and inspection frequencies allows operations directors to compare vendor performance across different properties objectively.


    Benchmarking reveals whether performance issues are isolated to a single building supervisor or represent a widespread failure across the contractor regional branch. It also provides asset managers with empirical proof when negotiating portfolio-wide service agreements and labor allocations.

Setting Up Your Facility Quality Program

Transitioning from reactive complaint management to proactive quality control requires discipline and reliable operational data. A well-designed scorecard removes friction from vendor oversight, aligns expectations between property managers and evening crews, and keeps commercial buildings running cleanly and consistently.

Start by selecting the five core KPIs outlined above, establish realistic defect thresholds with your contractor, and commit to a joint monthly inspection schedule. Documenting building standards consistently month after month protects your facility assets and ensures your service contractor delivers the standard of cleanliness your occupants expect.

If you want a second set of eyes on your current quality program, System4 IPS schedules on-site facility walkthroughs across Rhode Island, Connecticut, and Western Massachusetts, or you can reach our team directly at (401) 615-7043.

Recent Posts

Gloved hand wiping a metal door handle with blue cloth; text reads, “Your Facility Has Germ Hotspots. Do You Know Where?”
March 16, 2026
Discover 6 hidden germ hotspots in your facility and how often they should be cleaned to reduce absenteeism, complaints, and tenant churn.
Office split-screen: man reviewing papers beside “Commercial Cleaning Comparison” ad and a handshake with checklist.
January 5, 2026
Split-screen visual: Franchise chaos vs. System4IPS managed clarity. A single dedicated contact for New England commercial cleaning.
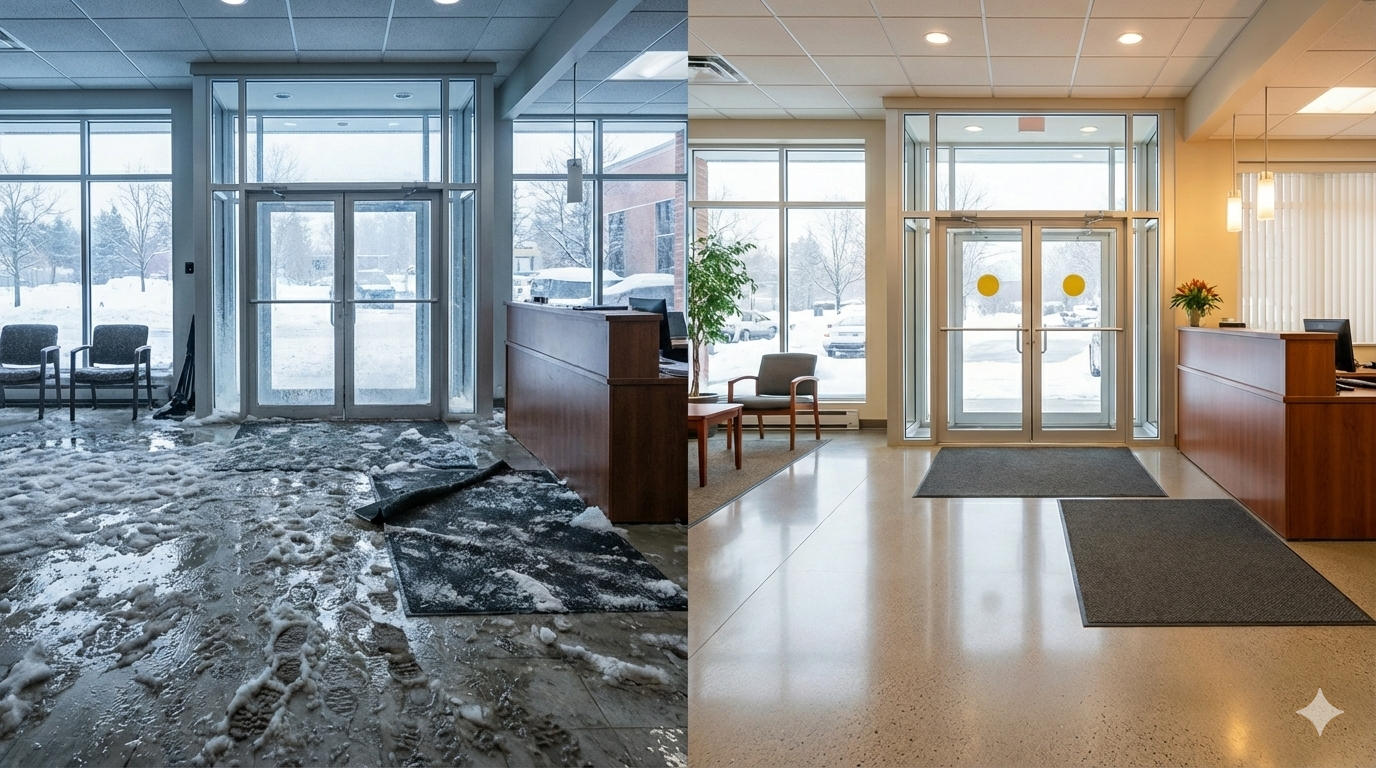
Snowy office lobby with glass doors, reception desks, and bright windows
December 17, 2025
Winter in New England is brutal on offices. From salt-eating floors to the flu season frenzy, her is the System4IPS guide to surviving the freeze without losing your mind.

Woman on phone holding a bucket to catch water leaking from the ceiling
November 17, 2025
When the Ceiling Leaks: How to Build a Facility Emergency Fund | System4 RI, CT & MA

Desk with calculator, pen, charts, and eyeglasses beside financial graphs and reports
November 13, 2025
Create facility management budgets without missing trends. Get expert advice from System 4IPS. Visit our site to learn more and plan effectively!
Five colleagues standing together in a modern office lobby, smiling with arms crossed
September 4, 2025
Don't take our word for it - read what RI, CT & MA businesses say about System4IPS commercial cleaning services. 99% client retention speaks volumes.
Person using an orange floor buffer on a glossy indoor floor
June 4, 2025
Don’t take our word for it—see the proof. System4 IPS delivers spotless commercial results in offices, restaurants, and apartments. Explore real transformations today!
Chef in white uniform holding his forehead in a busy commercial kitchen with stainless steel equipment
June 2, 2025
Need help passing a health inspection? System4 of Southern New England offers certified deep cleaning for restaurants, commercial kitchens, and food production facilities in RI, CT & Western MA. Emergency service available.
People sitting and chatting in a bright hallway with rugs, chairs, and potted plants
May 5, 2025
Ensure spotless student housing with expert turnover cleaning services. We deep clean apartments, dorms & shared housing to prepare units for fast, stress-free move-ins.
Person disinfecting desks in a colorful classroom with orange and yellow furniture
By monique April 28, 2025
Discover why schools across Rhode Island, Connecticut, and Massachusetts trust antimicrobial coatings to create cleaner, safer learning environments. Learn how this advanced protection supports healthier classrooms and reduces maintenance costs.
Show More